

January 29, 2015 Visualizing BMI’s “Blind Spots”
Body Mass Index, commonly known as BMI, is something you’ve probably calculated for yourself at some point. It’s a metric that places you on a health scale that’s purely based on your height and weight. For example, I’m 6’1” and 197 lbs, which places me in the “overweight” category with a BMI of 26.0. I’d say that I’m relatively muscular and somewhat big-boned, but could probably stand to lose a few pounds depending on who you asked.
You can calculate your own BMI using our BMI Visualizer:
BMI is a very controversial metric, often scrutinized for not taking enough information into account to produce meaningful results. It fails to consider important factors like age, gender, body mass composition (muscle vs. fat), or body mass distribution (body shape). This means that people can be placed incorrectly on the BMI scale, depending on their actual body type. And even though BMI was not originally intended to be used as an individual health metric[1], it is now often used as such. This can become more of a problem when it is employed beyond the individual level as a quick and easy metric for group and population statistics. This is concerning, as its shortcomings can become even more apparent and misleading when it is used to evaluate health in the aggregate. However, looking beyond these potential issues, there is also evidence[2] that has shown it does act as a good measure of obesity, and thus can be used as a general health metric to base medical treatment on.
The point of this post is not to reinforce or tarnish the validity of BMI. I am not qualified to do either. Rather, I’d like to bring some of its shortcomings to light through data visualization, and look beyond it to newer and more thoughtful alternatives. These shortcomings must be considered when using BMI, and when thinking about how to improve upon it.
HOW IS BMI CALCULATED?
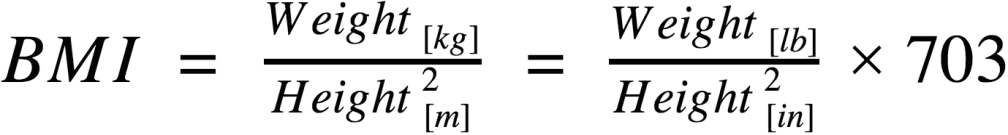
Your BMI is calculated using your height and weight, as determined by the following equation:
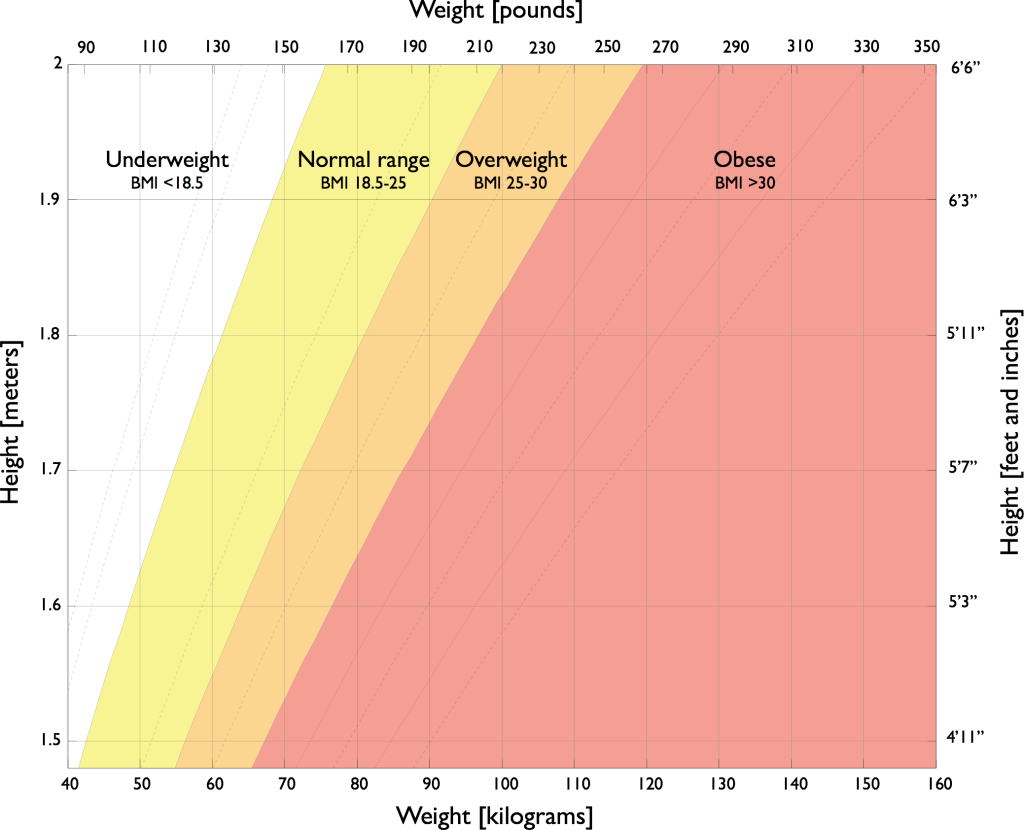
With this calculated BMI value, you are placed into one of four weight categories:
BMI’S SHORTCOMINGS
Since BMI doesn’t take body mass composition or distribution into account, it is basically blind to fitness level and body shape. You probably won’t be found to be obese when you’re actually underweight, but for people who are borderline, being misplaced is easy. For example, you can be an athlete in great shape and be deemed overweight or even obese. Or, you could have an average BMI but carry a significantly higher amount of mass in your torso, which as some studies show[3] can be a predictor of health risks such as cardiovascular disease or diabetes. Shouldn’t our go-to health metric account for things like this?
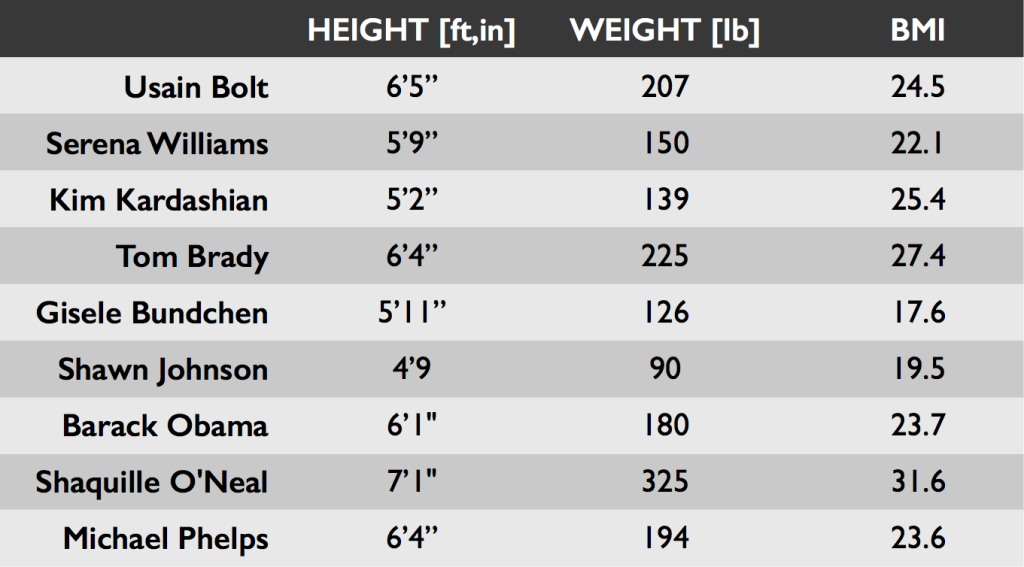
For fun, and to give you a better idea of what BMI “looks” like, here’s a list of some well-known people and their heights, weights, and BMIs (heights and weights may not be accurate or up to date):
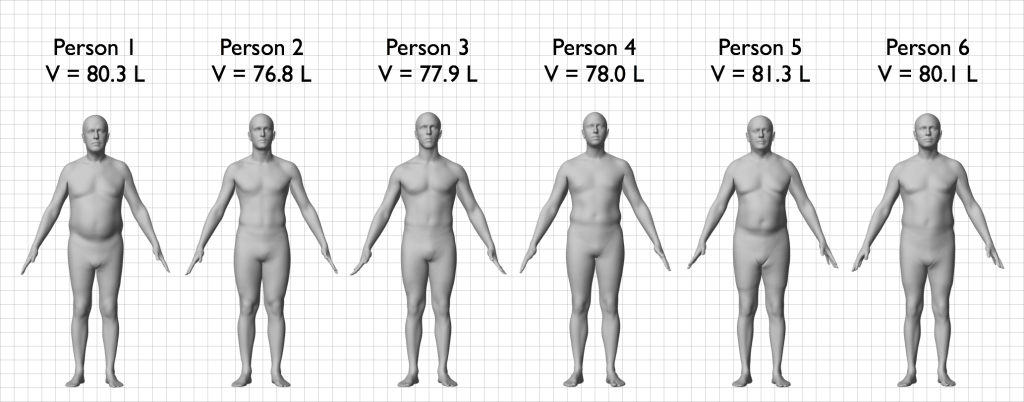
Here at Body Labs, we have lots and lots of data surrounding the human body. Mainly, we have thousands of 3D body scans and metadata, which we’ve quantified and analyzed by converting them into body models — if a 3D body scan is like a scanned sheet of text, a body model is like a Word doc. As an attempt to show BMI’s blind spot, we reached into our data and pulled out some examples of people with the same height and weight, and thus identical BMI values.
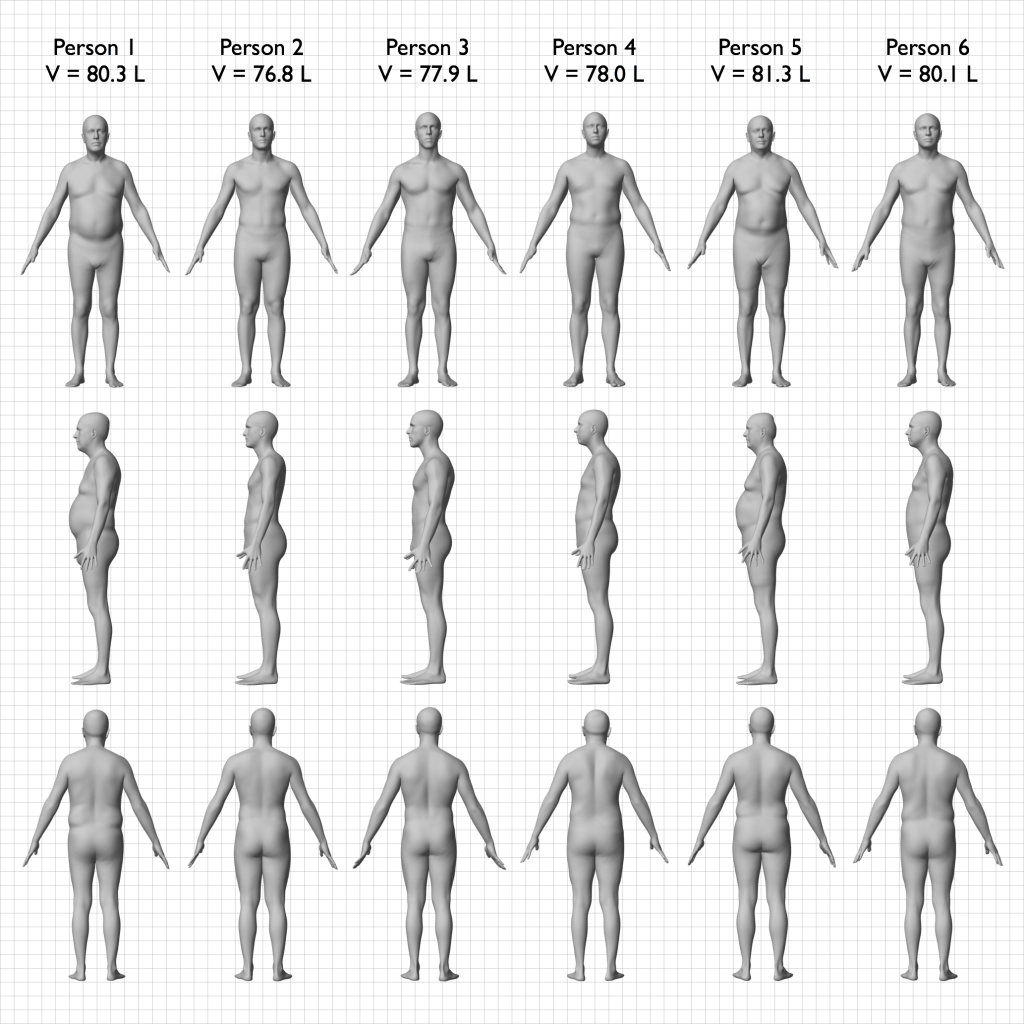
These are body models created from 3D body scans of various people. Each of these people are 1.75m tall and weigh 78kg (after being rounded to the nearest cm and kg), resulting in a BMI of 25.5. This means they barely fall into the “overweight” BMI category. Each person’s volume was digitally calculated using their body model.
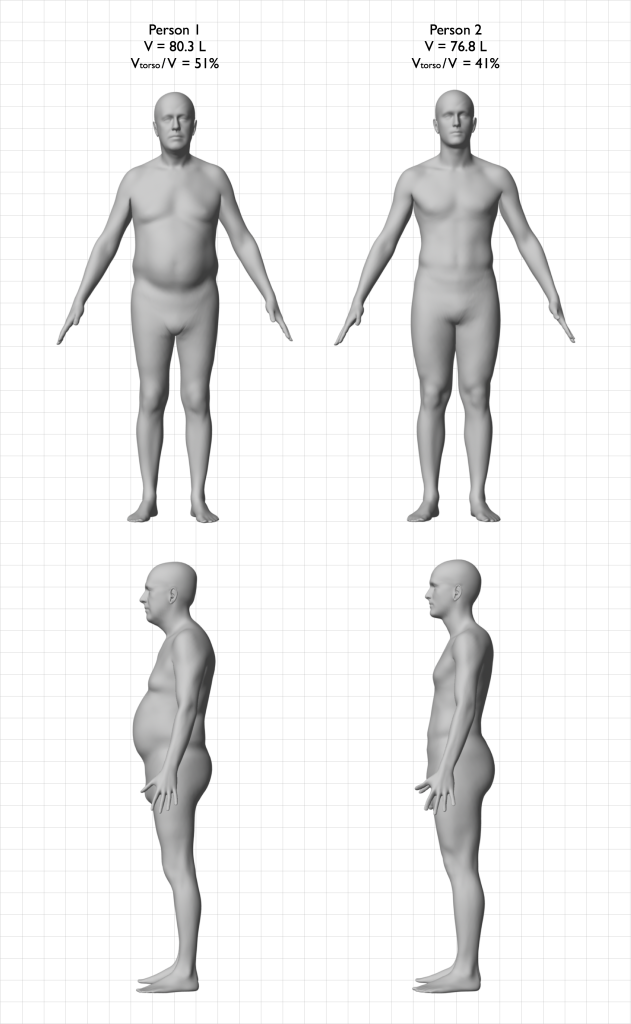
An enlarged view of person 1 and 2. Their torsos were separated out from their bodies so that the volumes could be measured independently. The six people had an average Vtorso/V of 46%.
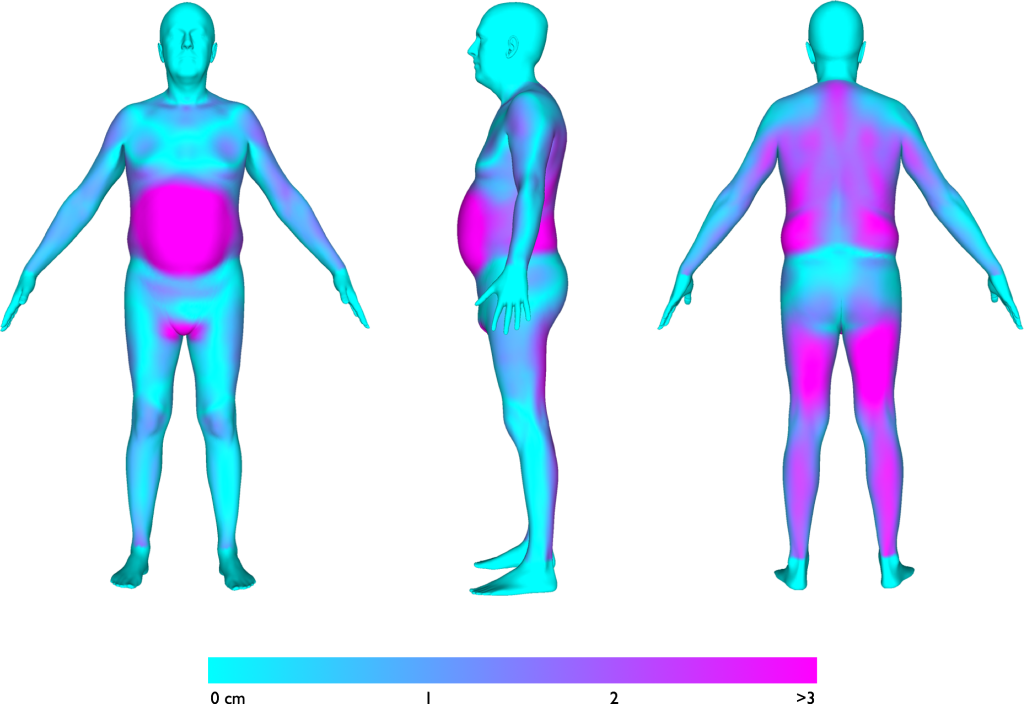
A heatmap comparison of person 2 to person 1. The heatmap coloring represents the point-to-point distances between the same points on both of their bodies (i.e. navel to navel). Blue means their bodies were the same, and hot pink means they differed greatly. You can see their bodies varied most in their stomachs, backs, back of legs, and leg lengths (as represented by the crotch area coloring).
As you can clearly see, especially from the heatmap comparison, bodies can have quite different physiques even if they have the same height and weight. You may have skinny arms and legs, but a big beer belly. Or you can have a built chest from working out, with little overall body fat.
The bottom line is that height and weight alone cannot accurately represent body composition, shape, or overall health.
LOOKING BEYOND BMI
Moving forward, there are many promising new methods for general weight and health measurement. Some of these take advantage of the growing proliferation of 3D scanners, such as the new metric named Body Volume Index, or BVI. It’s still in the early stages, but generally, it measures your total body volume and the volume of individual body segments (i.e. torso, arms, legs, etc.). By more directly measuring body shape through body volume, BVI would potentially catch the differences between person 1 and 2 that BMI did not. And even looking beyond BVI, with technology like ours, much deeper analysis is possible by doing direct body-to-body comparisons, and using methods such as machine learning to look for non-obvious correlations between body shape and health.
Because 3D scanning and technology like ours have not been accessible until recently, this sort of measurement and analysis was never possible or economical. However, all of this is possible today and will only become cheaper, easier, and more accessible. Here at Body Labs, it’s one of our goals to enable the creation of new and innovative health metrics. With a little time and research, you might just find yourself calculating something other than your BMI in the near future…
NOTES
[1] BMI was originally devised by Belgian mathematician Adolphe Quetelet to describe the relationship between normal human proportions, of height and weight, in adults.
[3] “Body size and fat distribution as predictors of coronary heart disease among middle-aged and older US men“, “Body Fat Distribution and Risk of Non-Insulin-dependent Diabetes Mellitus in Women“, “Body Fat Distribution and Risk of Cardiovascular Disease”
The “Body mass index chart” was created by User:InvictaHOG. Licensed under Public Domain via Wikimedia Commons